A few weeks ago, when we didn’t yet have adequate testing, I started going to individual state public health pages. States are required to make weekly reports about flu activity, and most states also collect “syndromic surveillance” meaning flu symptoms even without a positive flu test. The lingo for this is “ILI” or “influenza-like illness.”
It was a lagging indicator to be sure, as it takes time to compile the data and write the report, but by last week it started to be clear that even without proper testing, things were looking bad in terms of Covid-19 cases in a large number of states. So then I knew.
I knew that as time went on, they were going to have to start hiding the data.
And that’s what appears to be going on. Here’s what happened when I attempted to access the syndrome data for Louisiana’s latest report:

Well, that’s ok, because even though they’re hiding the data now on the state website, it’s still visible on the federal fluview website. So here’s what they don’t want you to see — the spike in recent cases:

Bear in mind this is data for “week 11,” which ended March 14th. It’s now March 26th so the data is waaay out of date.
What about Florida?
Well, their reports are still visible, and at first glance they appear to be the same. The charts look similar, and they have the same number of pages. So they’re not hiding anything….or are they?
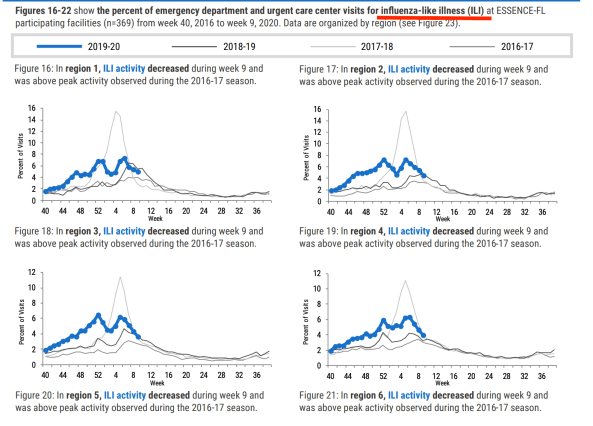
Here’s Figure 1 from Week 9:

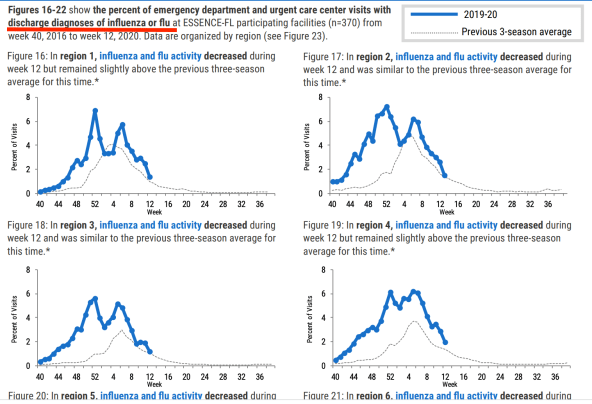
And here’s the “same” chart from Week 12:

If you just look at the chart, it appears that the numbers of ill people are going down. But if you look at the fine print, they’ve changed the report. The reports for weeks 9, 10, and 11 were for “influenza-like illness,” but for week 12 it changed to “diagnosis of influenza or flu.” Hiding the Covid.
But wait there’s more! Let’s look at this series of graphs. Looks like things are improving since week 9, right?
Week 9:
Week 12:
Again, they changed the criteria of the report. If they’d kept it about “influenza-like illness,” then floridians could see what is probably a massive uptick in cases. But no, they just quietly decided to change the report instead.
The only place you can get a hint of what’s happening is here:

See how “flu” is going down in elder care facilities, while “ILI outbreaks” are increasing? That’s (most likely) Covid.
How hard is Florida trying to hide? Well, I can’t say for sure, but when you go to the National FLU VIEW page, the only state with no ILI data is Florida.
So, to review — Louisiana is putting its latest syndromic surveillance data behind a firewall, while Florida is completely changing its reports to keep the information off the radar. Not good.
Just thought y’all should know. Maybe your state is hiding the data, too.
~Update~
This post is getting a lot of traffic, so I wanted to add some links for those who want to do their own research:
Florida Flu Review Week 9, includes lots of ILI data
Florida Flu Review Week 10, same format
Florida Flu Review Week 11, same format
Florida Flu Review Week 12, most ILI data now missing
Note: I have downloaded all of these reports, so if anything changes later, please let me know.
